Agriculture
At N&P FOREST WOOD WORK we transform agriculture.
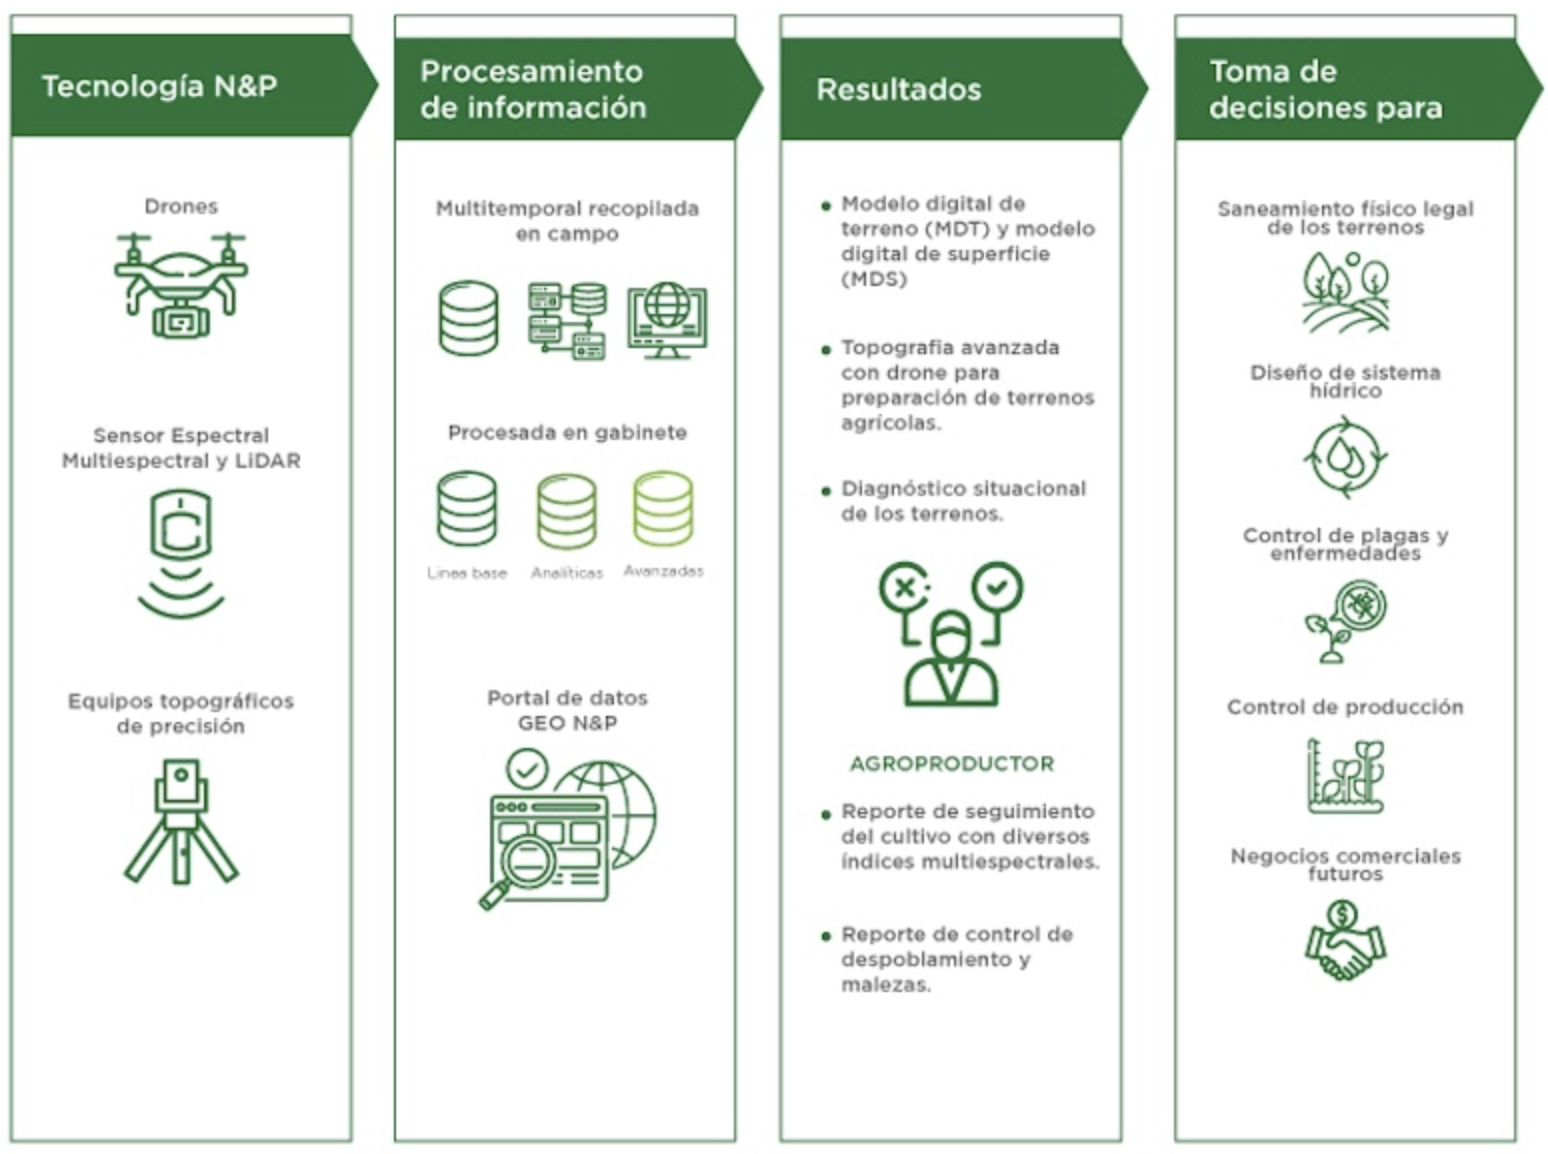
Precision agriculture integrates topography, georeferencing, and photogrammetry to optimize crop management in Peru, enabling more precise and efficient decisions. Through our GEON&P platform, users access advanced technology and detailed reports that improve productivity, reduce costs, and strengthen the competitiveness of the agricultural sector nationwide.
Discover how we can help you maximize the potential of your crops and take your production to new horizons!
SERVICES
Precision agriculture:
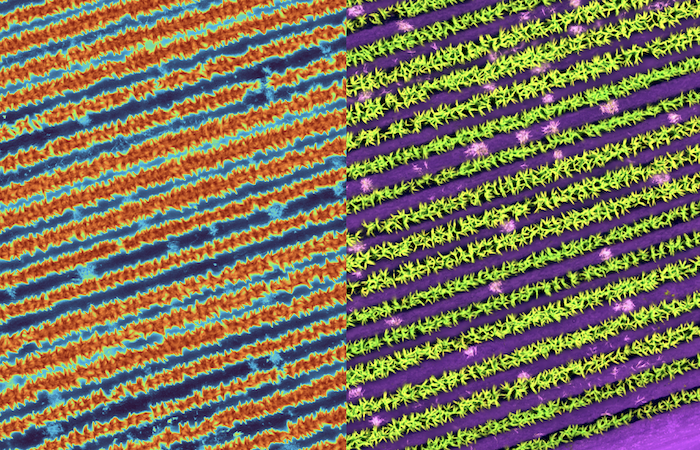
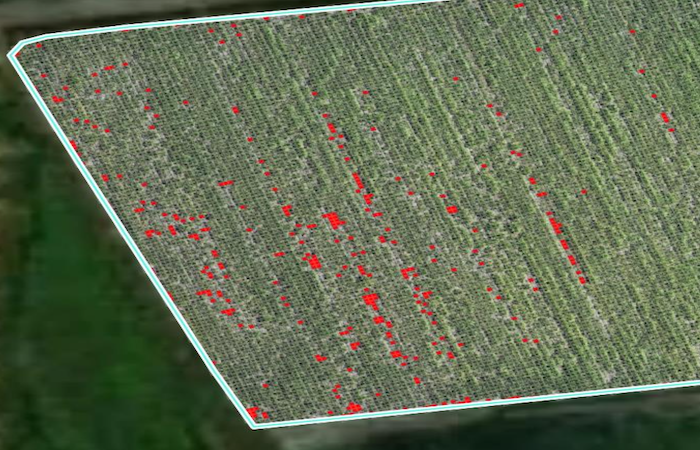
- Satellite and drone monitoring based on various multispectral indices such as:
- RGB
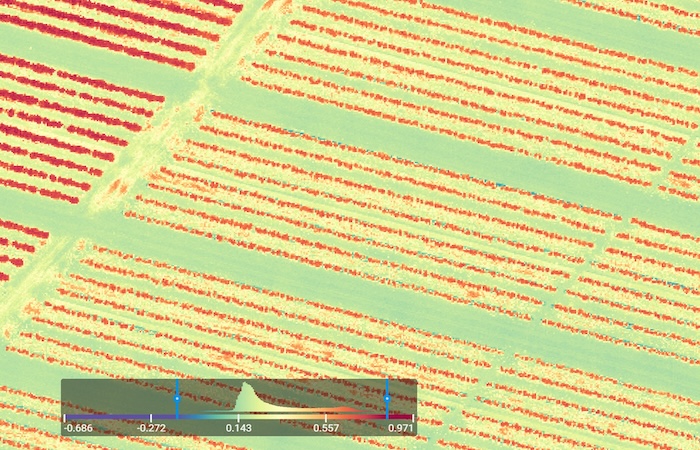
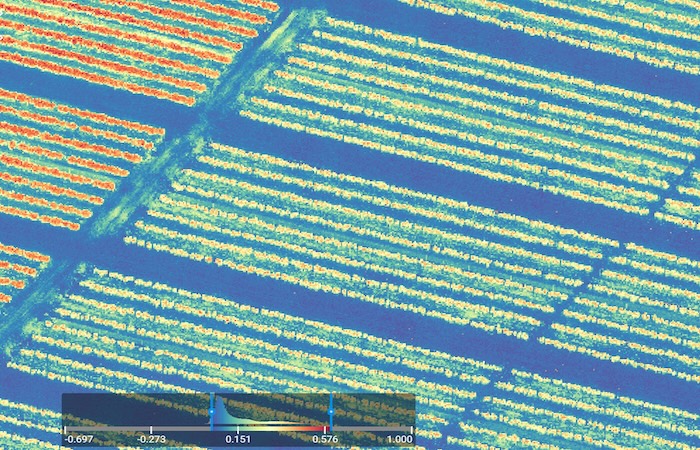
- NDVI = Vigor
- NDMI = Leaf Moisture
- NDRE = Leaf Nitrogen
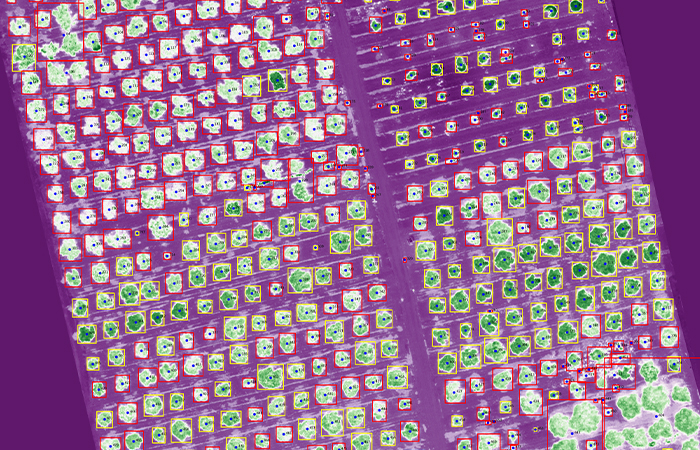
- Detection of depopulation and weeds.
- Visualization of historical data in satellite and drone images.
- Visualization of statistical information in plot-level graphics.
SOLUTIONS
The information obtained will allow the client to access the following solutions, for optimal and timely decision making:
- Spatial accuracy in identifying the health status of agricultural crops.
- Automated detection of depopulation and weeds using high-resolution images, identifying affected areas with georeferenced precision.
- Analysis of historical data and crop evolution with statistical information.
- Improvement in harvest planning and final product quality.
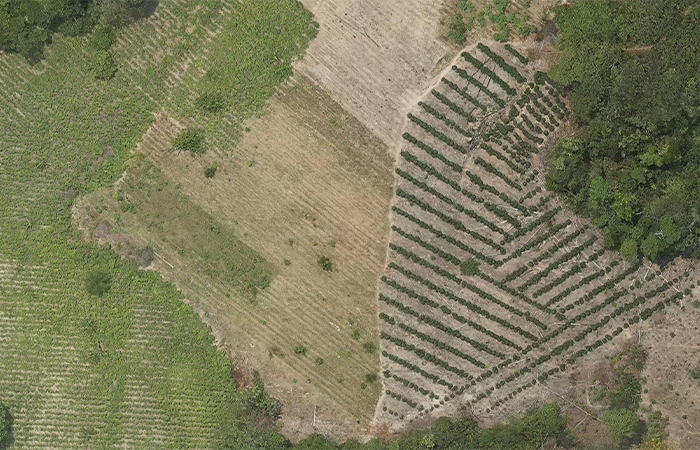
- Location and classification of crop areas.
- Digital terrain modeling and contour lines for planning and designing water systems, field layout, access routes, among others.
- Detailed and classified planimetry of the area of interest.
- Technical and legal analysis of the land.
- Knowledge of the socioeconomic situation of the area of interest and conflict resolution.
ONLINE VISUALIZATION IN GEO N&P (GEOPORTAL)
GEON&P is a digital tool (GEOPORTAL) that enables real time and multi temporal data visualization, querying and analysis.
The processed field data is presented through reports consisting of images, maps and database; all consolidated into interactive dashboards that help clients make decisions based on accurate and reliable information.
What can we visualize in GEON&P?
- Heat maps starting from the seedling stage.
- Percentages of healthy hectares at lot, parcel, and plant level.
- Crop behavior analysis by agricultural campaign.
- Crop physiological status:
- Crop Vigor.
- Photosynthetic activity.
- Chlorophyll content.
- Water stress in plants.
- Levels of damage caused by pests and diseases.
- Production history by agricultural season.
- Land boundaries.
- Terrain modeling.
- Geodetic control points.
- Georeferenced information layers.